Statistical Learning, Slowly
Over the past month diving deeper into data science, I came to appreciate the slow, methodical process of building a knowledge base enabling me to choose the appropriate stats model for a given situation. While my exploratory data analysis skills grew quickly through tutorials and documentation, the same was not quite true for my data science intuition.
Nonethesless, I am proud of my progress. I dusted off the statistics I learned during experimental psychology in undergrad and reaquainted myself with normalization, t-tests, and linear modeling. After cleaning and merging my data frames, I tooled around with the target attribute (a.k.a. 'response' or 'dependent variable'). Initially, I aggregated student-level data to get one metric per tutor using the function:
TutorScore = N_StudentsMetTarget ^ 1.5 - N_StudentsMissedTarget ^ 1.3
This method gives disproportionate weight to tutors with larger tutoring groups. A tutor who had 8 students hit their target and 4 students miss gets a higher score than a tutor who had 4 students grow and 2 miss. It also defines the magnitude of one student meeting their assessment target as slightly greater than that of a student missing.
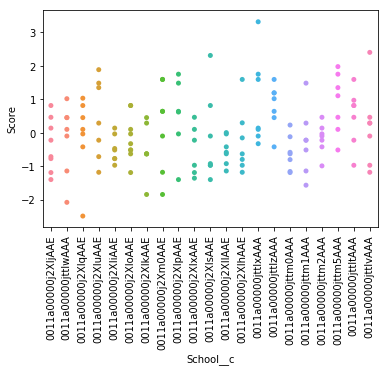
Using this score as my response/target/dependent variable, I began to explore what other attributes might correlate. The graphic below shows tutoring performance distributed by schools. There appears to be some difference in tutor performance by school (i.e. an 'effect of school membership'), as we would expect.

Another way my organization classifies successful tutors is by observing and rating their tutoring sessions. Coaching staff rate tutors in 5 categories: Planning, Effective Tutoring, Effective Student Engagement, Student Program Monitoring, and Application of Training. Below are the relationships between observation-based tutoring scores and student-growth-based tutoring scores. Tutoring ratings were aggregated via mean by tutor, and each coach's mean-rating set was normalized via z-score. The shading represents the 95% confidence interval.
Here is the same data colored by the coach who provided the rating.
While the confidence intervals are quite large, there is some evidence for positive correlation in 'ESE Rating' and 'Learn Rating' for a couple coaches. Perhaps there are groups of tutors whose tutoring ratings in fact relate to their students' assessment growth, but only at certain schools, or only if they acheived a certain number of tutoring minutes with their students.
Basically, these models do not really satisfy the questions I sought to answer. By aggregating the student data under each tutor, I unnecessarily lose fidelity (for example, I lose the count of students and magnitude of each student's growth). More importantly, my data is hierachical. Sets of ~12 students are grouped under tutors, who are grouped in sets of ~9 within schools, of which there are 26. Differences in student performance are likely explained in part by the school the student attends, so it would be disingenuous not to account for that effect.
This is where further statistical learning comes in. We need Random Effects or Hierarchical Models, potentially even some Bayesian inference. In these models, we establish some measure of the group-level correlation (i.e., what percent of students in a school met their target as a function of tutoring time), and then assess how far off each group individual is (what percent of a tutor's students in that school met their target as a function of tutoring time). This allows us to more accurately identify the tutors who are over or under performing.
More Learning
I found myself at yet another point requiring that I step back and hit the books (and "the docs"). Lately I have drawn heavily from these resources:
- Introduction to Statistical Learning Lectures - a nice overview of the techniques that have come to be referred to as "data science"
- Probabilistic Programming and Bayesian Methods for Hackers - excellent intro to Bayesian thinking with Python applications
- Data Science for Business, a textbook mentioned in earilier posts
Meanwhile, back at the ranch
While working and reflecting through this Python mentorship journey, I have experienced some internal and external shifts in factors related to my project. Last week, my organization confirmed a data sharing agreement with CPS, going into effect next school year. So far all the data I have been working with has been hand-submitted, prone to human error and missing entries. What's more, our school year ends June 16, so my analysis would only include half-year data at the end of this mentorhsip.
Internally, I have felt some #FoMO about the web app world, and externally I identified a nice business need. As the cherry on top, my mentor Aly is a rockstar webdev. Dabbling in web apps sounds like an excellent way to round out my Python learning while furthering my interests in data analysis (there will be a dashboard component). Plus, I get to keep all the data science learning I have accomplished so far and put it to use when the cleaning is easier and the data quality pristine.
Web App Development
In ChiPy Blog 1, I mentioned that I cowrote an R-based algorithm to place our AmeriCorps Members into school teams. The current plan is to deploy this algorithm through a Power BI dashboard, but there are some significant drawbacks. This requires the user to install all dependencies and manage any compatibility quirks. It is also limited to a 30 minute runtime by Power BI. Most frustrating of all, due to a bug, the entire algorithm runs twice. This taxes computer resources and pushes us closer to that pesky 30 minute threshold.
So for the next month and a half, in addition to keeping up my data science studying (and stalling until it becomes easier), I am working on a Django web app packaged into a Docker container. I already have a nice start thanks to the Django Girls Tutorial, which I highly recommend.
For the unfamiliar, Django is a web framework that handles some of the heavy lifting in web app development. With a few Python classes, you can define database models and iteratively construct webpages that query those models based on url rules.
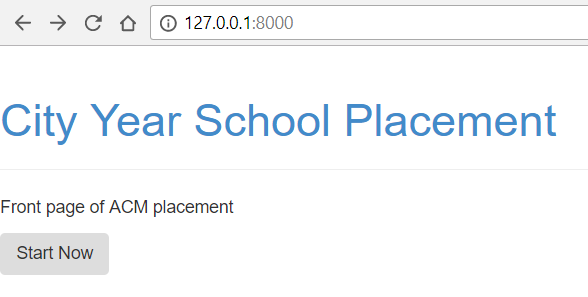
Here's where I am at, but rest assured there's more under the hood:


